Easily Set Up Monitoring for Your Rocky Linux Server Using the Linux Integration for Grafana Cloud
Editor's Note: This blog was originally published on the Grafana Labs website. Below are excerpts of this post.
Grafana Cloud is the fully managed observability platform that is powered by the open source Grafana LGTM Stack (Loki for logs, Grafana for visualization, Tempo for traces, and Mimir for metrics).
Based on a “big tent” philosophy, which promotes interoperability with a wider observability ecosystem, Grafana Cloud integrates with various data sources, including databases, cloud services, and custom applications, to provide users with a unified view of your data through interactive and customizable dashboards.
Grafana Cloud has a Linux integration that can run on most of the Linux distributions, including Rocky Linux. The Linux integration uses the node_exporter embedded inside Grafana Agent, which makes it easier to use and set up. The integration also supports monitoring of logs using Grafana Cloud Logs.
How to configure the Rocky Linux integration with Grafana Cloud
The Grafana Cloud Linux integration supports all released versions of Rocky Linux. You can start monitoring your Rocky Linux server with Grafana Cloud by following these simple steps:
- A Grafana Cloud account is required to use the Linux integration. If you don't have a Grafana Cloud account, you can sign up for a forever-free account today.
- In your Grafana instance on Grafana Cloud, use the left-hand navigation to get to the Connections Console (Home > Connections > Add new connection).
- Install the Linux Infrastructure Integration and click on Run Grafana Agent, select “RedHat-based” for Rocky Linux as your OS and select the relevant architecture.
- Follow the provided instructions in the UI to configure Grafana Agent to collect logs and metrics. Please refer to our documentation on how to install and manage integrations for more information. For details around configuring Grafana Agent for this integration, refer to the Linux Server integration documentation.
Start monitoring your Rocky Linux instance
Rocky Linux dashboards
After the integration is installed, you will see seven different pre-built dashboards for Linux and a set of Linux-related alerts automatically installed into your Grafana Cloud account.
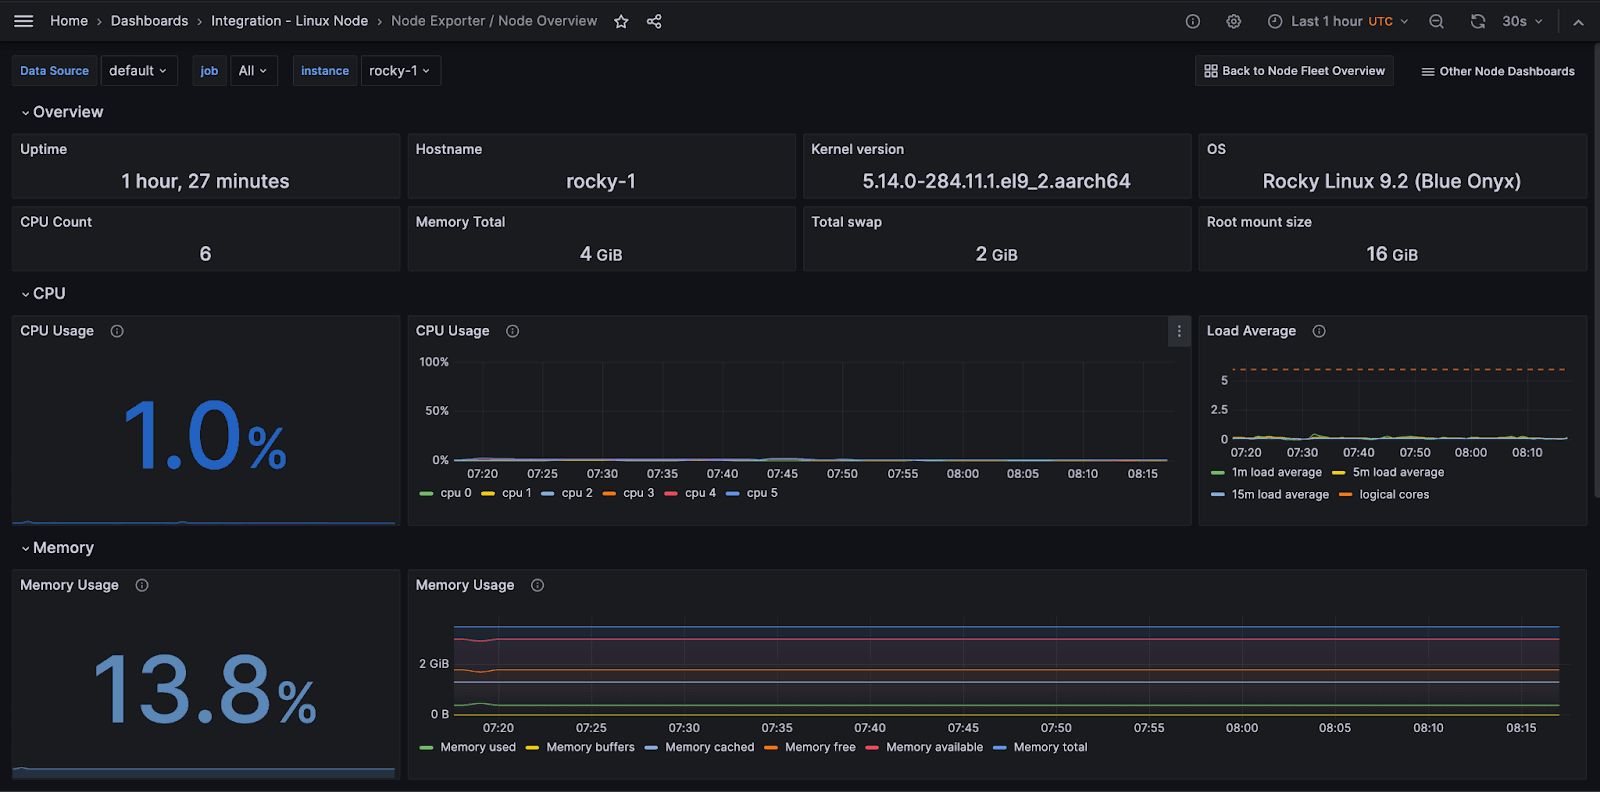
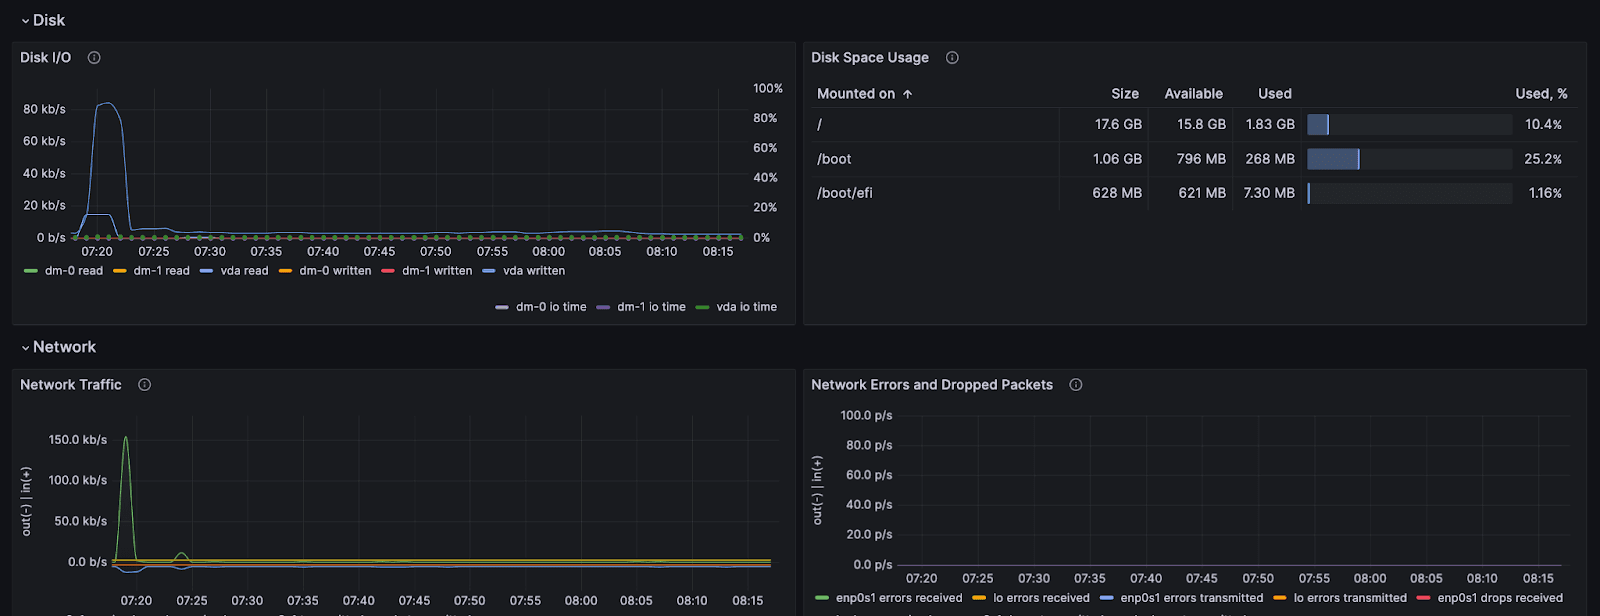
Node overview
This dashboard provides a comprehensive overview of a single server. It offers a high-level overview of the different resources, i.e., CPU, memory, disk, and network.
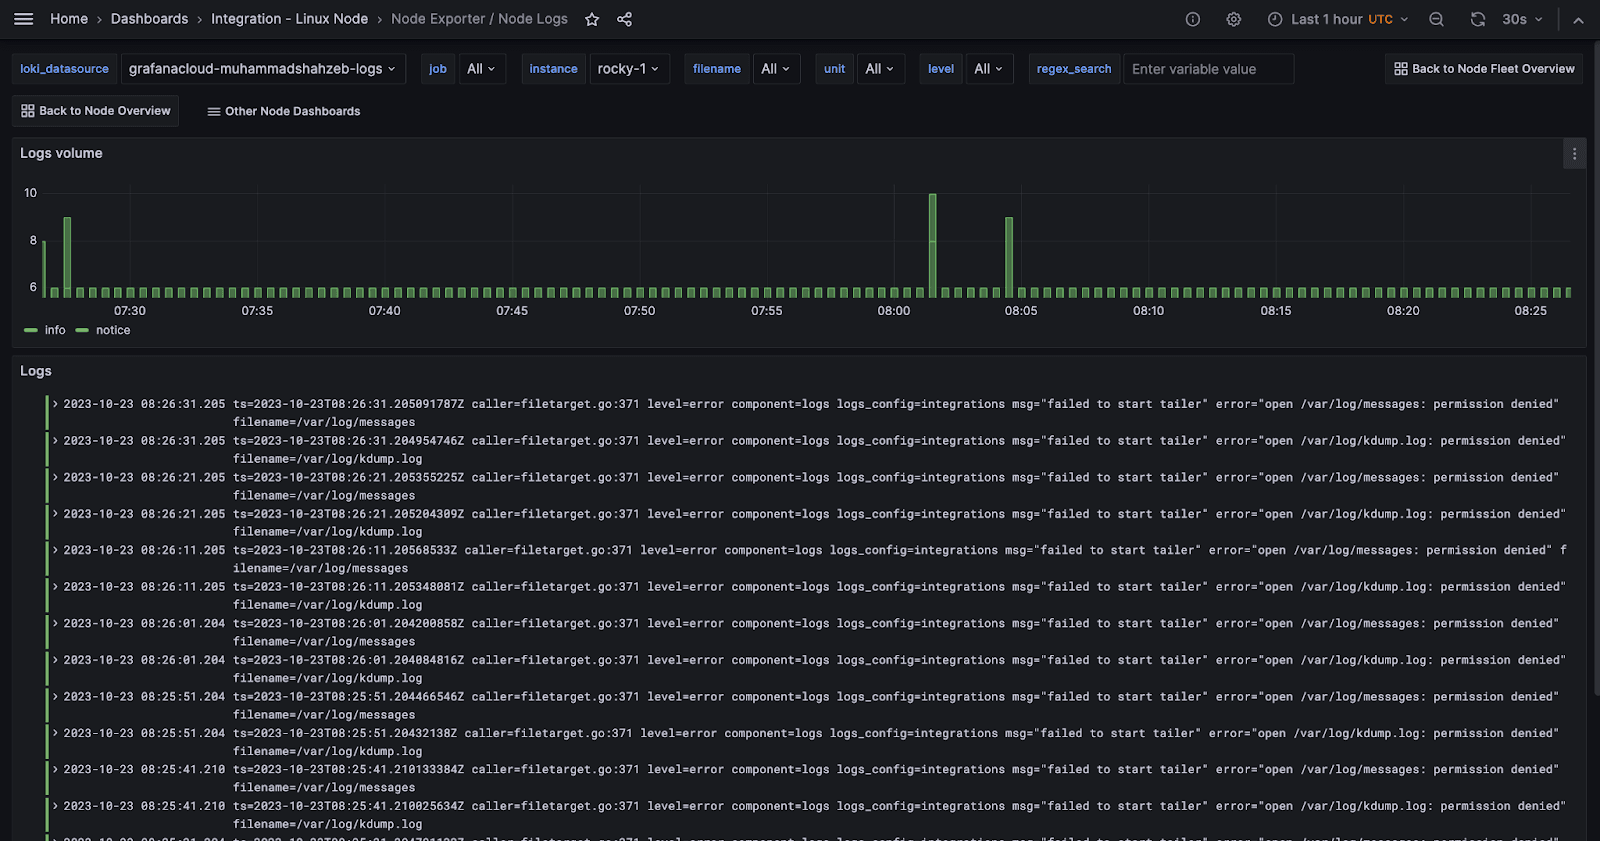
Node logs
The Rocky Linux integration also collects Linux logs with the help of Promtail embedded inside Grafana Agent. The logs dashboard can be used to monitor the logs and debug issues as well.
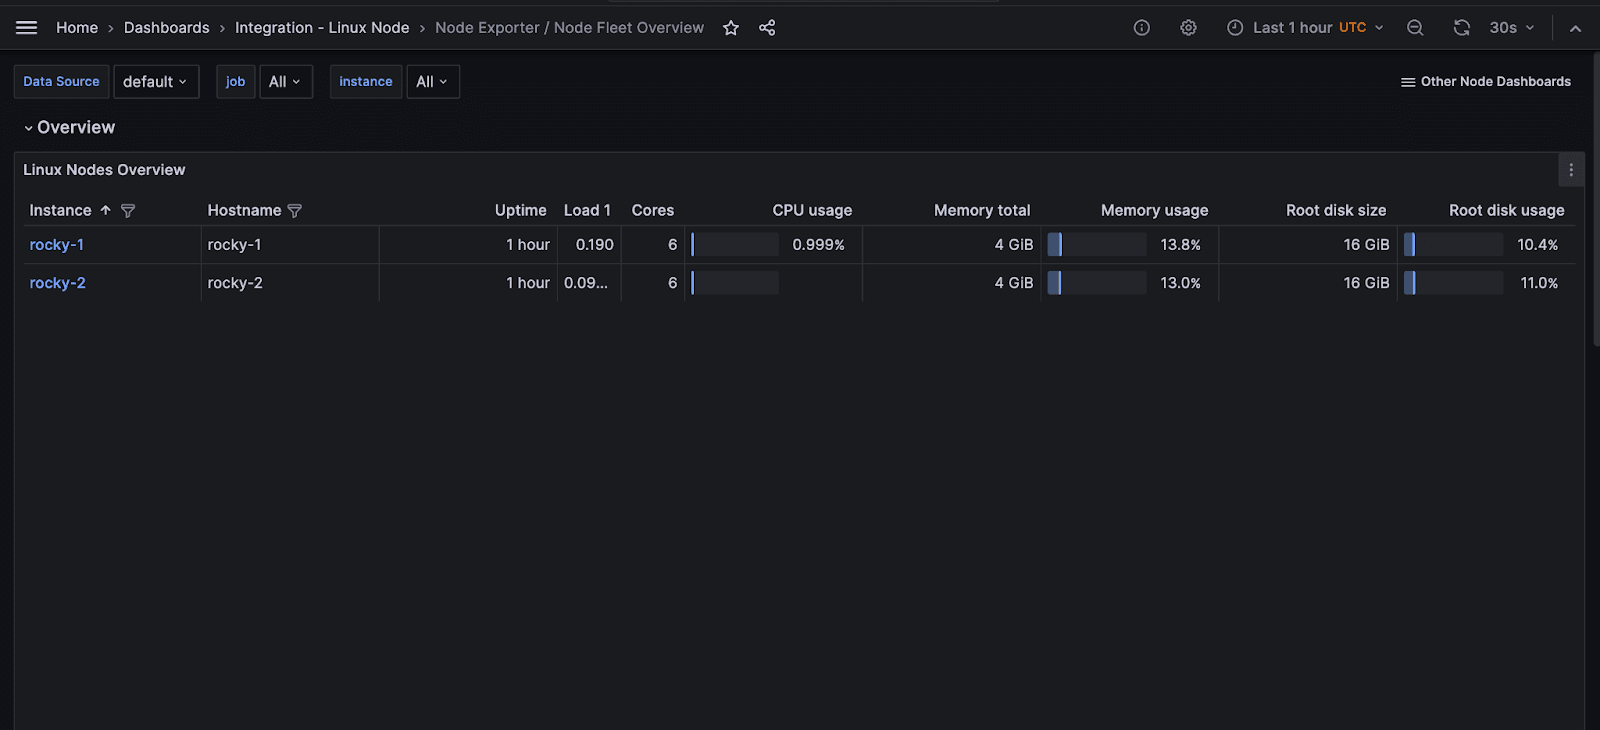
Node fleet overview dashboard
In an environment where you have multiple servers running, this dashboard is very useful for monitoring all the instances at a glance. You can also click on an instance to open the node overview dashboard for that specific server.
Other node dashboards
The Linux Server integration installs the following dashboards in your Grafana Cloud instance to help monitor your system.
- Linux node / CPU and system
- Linux node / filesystem and disks
- Linux node / fleet overview
- Linux node / logs
- Linux node / memory
- Linux node / network
- Linux node / overview
All these dashboards can be easily accessed by clicking on the Other Node Dashboards shortcut link at the top right of the dashboards.
Rocky Linux alerts
The integration includes a variety of useful alerts.
Here's an example to illustrate their utility: We have pre-set alerts to notify you about high resource usage or when node resources are fully utilized. The NodeSystemSaturation alert, for example, is designed to warn you when systems are at risk of running out of their available resources, allowing you to act accordingly.
More detail about these and other preconfigured alerts can be found in the integration documentation. All alerts thresholds are default examples and can be configured to meet the needs of your environment.
Rocky Linux Enterprise Support
CIQ, the founding sponsor for Rocky Linux, provides Enterprise support, security, patching, and automation tools to streamline your environment. Learn more by visiting https://ciq.com or by requesting more info here!
Start monitoring Rocky Linux with Grafana Cloud today
These dashboards and alerts can help you easily get your Rocky Linux monitoring up and running. Sign up for a free Grafana Cloud account and give it a try, and let Grafana team know what you think by reaching out on the Grafana Labs Community Slack in the #Integrations channel.
Go to the Grafana Labs blog to read the full article on monitoring Rocky Linux with Grafana Cloud.